Investigation
|
PHYSICS 1.1
All the NZQA info you need to know about this standard:
CHEMISTRY 1.1
All the NZQA info you need to know about this standard:
How to Write a GREAT Report
AIM
HYPOTHESIS
METHOD
RESULTS
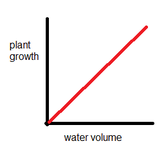
2) Put a label on each axis with its units. If you recorded how long something took in seconds, your label isn't "seconds", it's "Time (s)" 3) Plot your points carefully with an x. 4) Add a title which includes both axis labels to describe your experiment. 5) For Physics, rule a line of best fit and use it to calculate your gradient for your equation. For Chemistry, draw a smooth curve through the points. CONCLUSION
DISCUSSION
EVALUATION
|
WHICH VARIABLE IS WHICH?
INDEPENDENT VARIABLE
This is what you have control over to cause an effect. When you're doing an experiment, you get to decide what the values will be. "I" for "independent" because "I" change it.
DEPENDENT VARIABLE This is what you will measure to see what the effect of your independent variable was. It's called dependent because it depends on the other variable to change. For example, if you always make a milo with identical temperatures, ingredients and volumes, it would always taste the same. BUT, if you start messing around with the amount of sugar you put in, the flavour changes depending on the amount of sugar. In this case, your independent variable is sugar amount, and your dependent variable is the flavour. You must include specific details about how it was measured. Include things like: equipment used, when to start and stop timers, units to measure in, etc. CONTROLLED VARIABLES
To be a fair test, you need to make sure you are ONLY CHANGING ONE THING! That means everything else has to stay exactly the same every time you run the experiment. Otherwise how would you know that the relationship you've discovered is true? If I gave Usain Bolt orange juice and gave you water and then measured you both sprinting, could I confidently conclude that orange juice makes you run faster? To write controlled variables, be very clear about all the things you did to try and make each trial identical. Watch out for anything that could cause contamination, bias or flawed results. 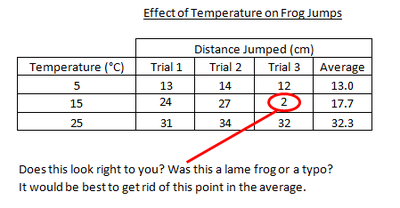
This is a nice graph.

Has this study got a reasonable grounding in reality? 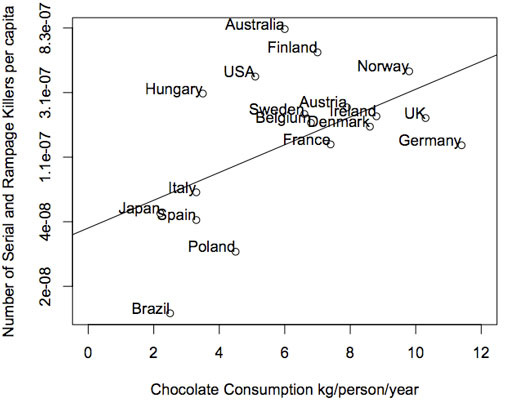
|
